It’s hard to know what you don’t know. But at a financial services firm, it’s important to try because unclear or incomplete insights into financial performance could lead to disastrous decisions. Does your firm have adequate visibility?
Without much effort, companies can now collect massive amounts of data. It flows into the average financial services firm automatically and starts accumulating immediately, fast becoming a reservoir of insights into what happens broadly and deeply. The leading firms in the industry are turning this data, which doesn’t say much on its own, into something much more valuable: insights.
From large volumes of data come deep insight into a firm’s strengths and weaknesses. At least theoretically. As many have learned firsthand, translating data into insights doesn’t happen quickly or easily. Firms have plenty of data to work with. What they lack is the time or tools necessary to refine the data into a format decision makers can act on.
Which camp does your firm fall into? Are you using your data to full effect or do you still have progress to make? The answer might be less obvious than you think because it’s hard to notice lost opportunities as they vanish – which is what happens when financial services firms can’t see what their data reveals. Asses your visibility into the data by asking these important questions:
It’s easy to assume that what you can’t see – in terms of performance or outcome metrics – you don’t need to know. Too often, though, what a firm focuses on is determined less by the firm’s decision making requirements and more by the limitations of the accounting software. Important insights remain invisible as a result. Consider what your current software can and can’t show you to start recognizing the blind spots in your own understanding.
Which metrics and benchmarks define success will differ between financial services firms. Some firms may be focused on the wrong metrics or may not be tracking enough metrics, leaving them with a skewed perspective on their own performance. Examine how you define success at your firm. Does that definition still fit the firm’s circumstances, outlook, and strategic objectives?

Just as important as knowing what to track is knowing how. Financial reporting provides a snapshot of performance. Given how much time and input reporting takes, however, most firms go weeks or months without updates. Take a critical look at how you track success because the process itself could actually impede the intended outcome.

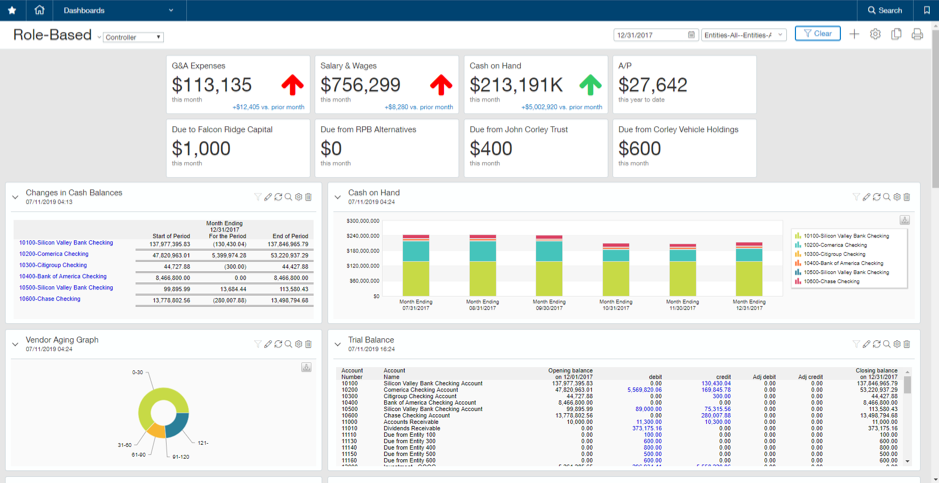
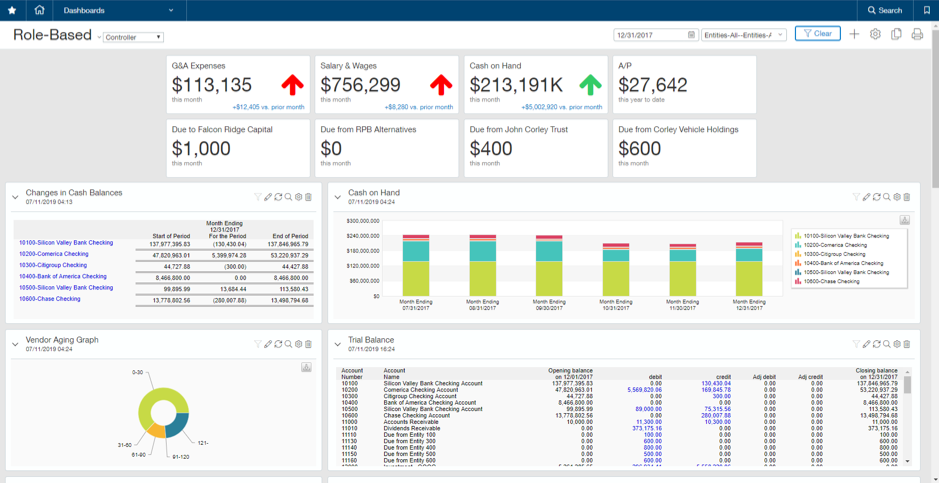
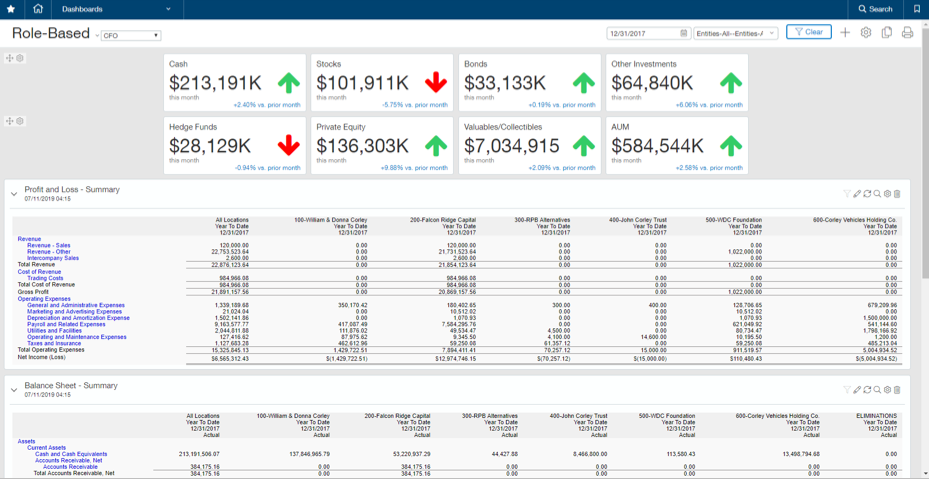
One way to evaluate your own visibility into data is to compare it against what’s possible. Sage Intacct replaces the need for reporting with a suite of dynamic dashboards that highlight key metrics which update themselves automatically. In practice, dashboards provide exactly what decision makers need in terms of visibility: a broad, deep, intuitive, and efficient look into all the data at their disposal. In that way, Sage Intacct dashboards reveal more yet require less.
Whether it’s IRR, cash positions, operational costs, or others, Sage Intacct’s native dashboards and visualizations, along with our statistical objects, can deliver current snapshots to your stakeholders on where you are and how you are doing. The dashboards are customizable, so you can set the performance cards that are relevant to your role, and see the most important KPIs at a glance. From there, it’s easy to drill down into any metric to view the drivers behind the numbers – giving management the tools and visibility they need to make proactive decisions.
Explore what those dashboards could reveal about your own data by contacting the team at Equation Technologies.
Most restaurant or franchise leaders feel the same way: Theyhave the data. They just never get it...
Equation Technologies
United States: 533 2nd Street Encinitas, CA 92024
Canada: #301 - 220 Brew Street Port Moody, BC V3H 0H6
Phone: 866.436.3530 • E-mail: info@equationtech.us
Equation Technologies ©2016